Filelight is a cool disk monitoring application that makes it easy to understand how the disk space is currently being used in Linux Mint/Ubuntu by representing it through pie charts.
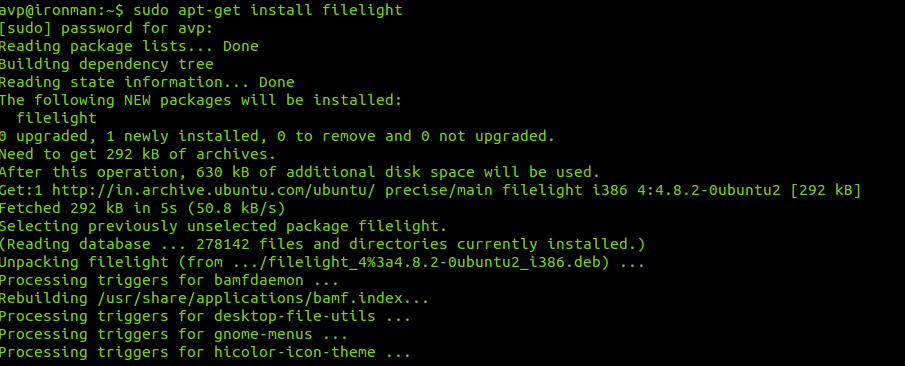
To install it, open Terminal and type :
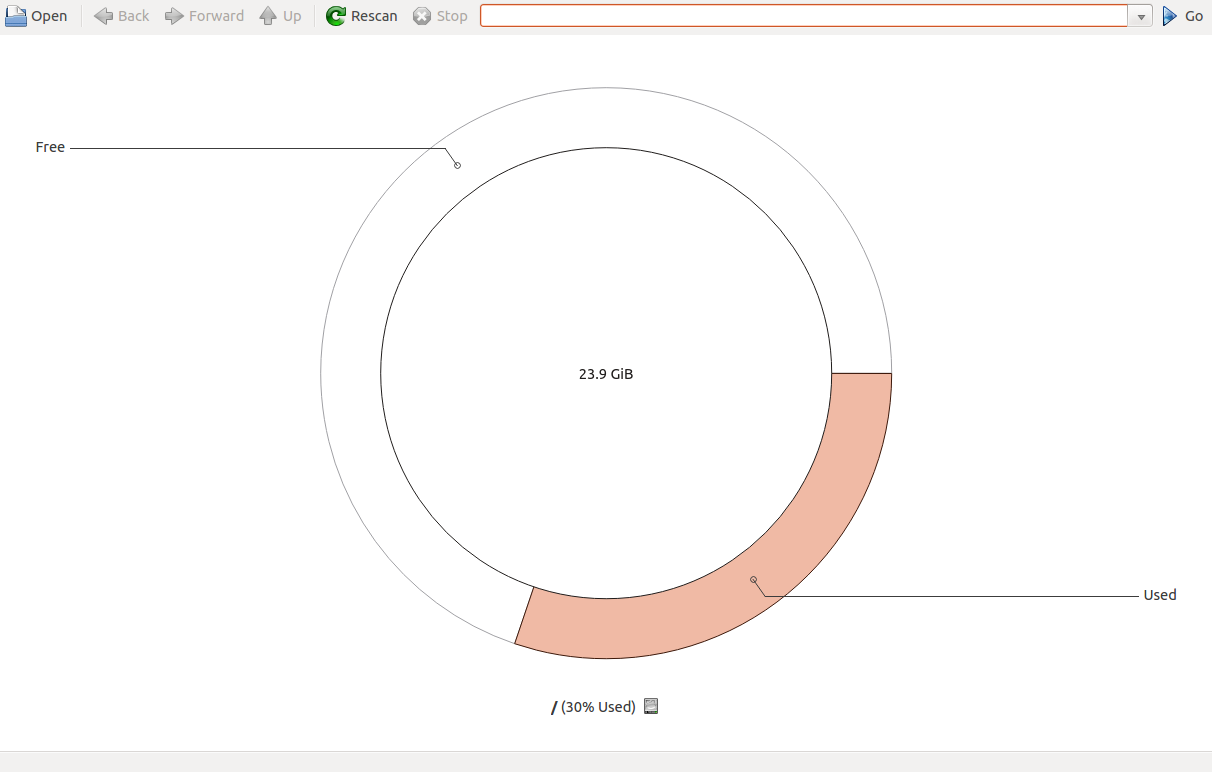
Once installed, Filelight will show the default pie chart representing the high level view of disk partition.
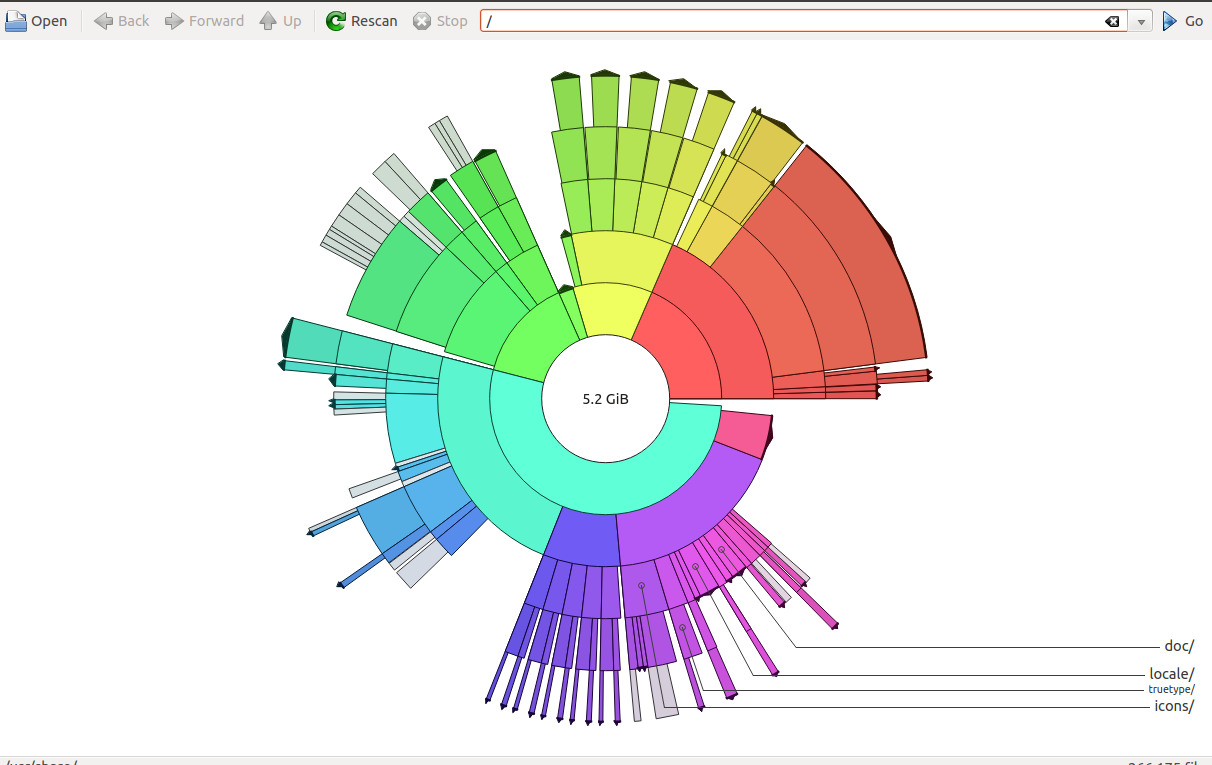
To know about how the space is utilized, simply click on any of the sectors. (This can take some time as Filelight will scan and list the complete directory structure for the same).
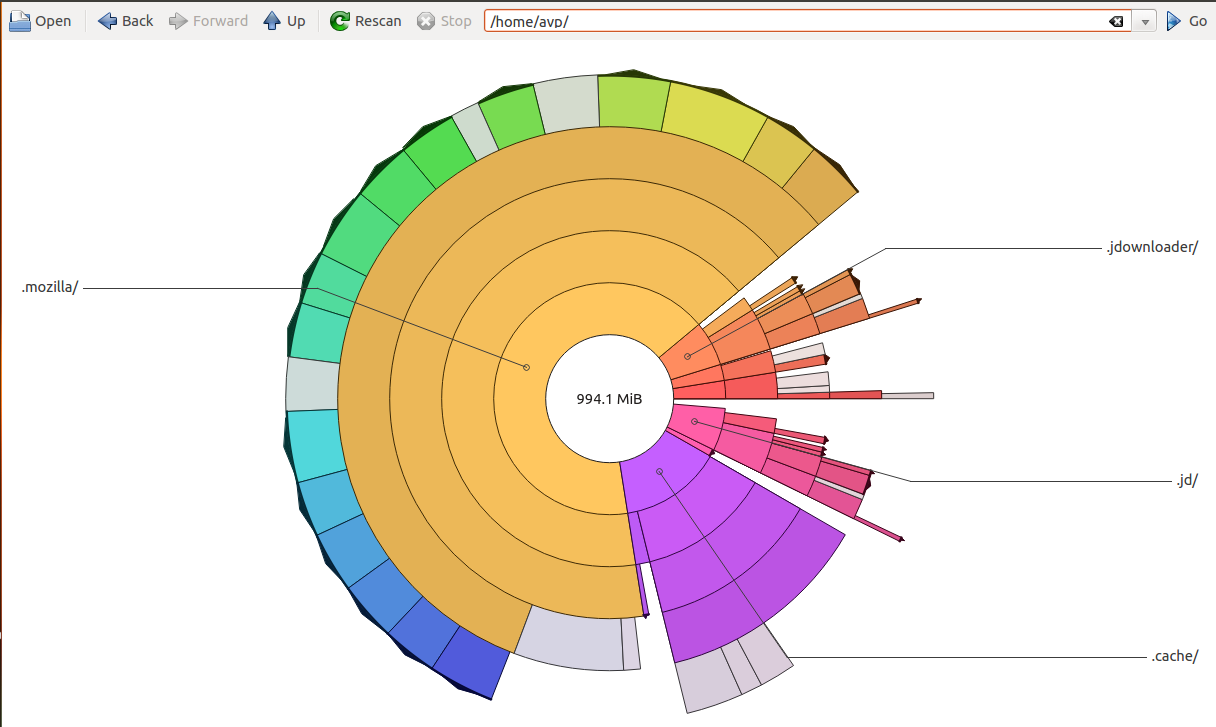
The other cool thing about Filelight is that by simply typing the directory path for which the disk utilization needs to be seen, just enter that path in the address bar (like the home directory in this example).
It will display the breakdown of the whole path and show which files and folders are currently residing.
Pretty neat application and the pie charts are so much fun to look at.  🙂
Cheers.


Its a new kind of tips…I really interested to learn about this linux charts…I know a lot of people will like this also…