With different tabs open in Google Chrome, using the built-in Task Manager in Chrome can be a useful starting point to troubleshoot browser unresponsiveness or high memory usage.
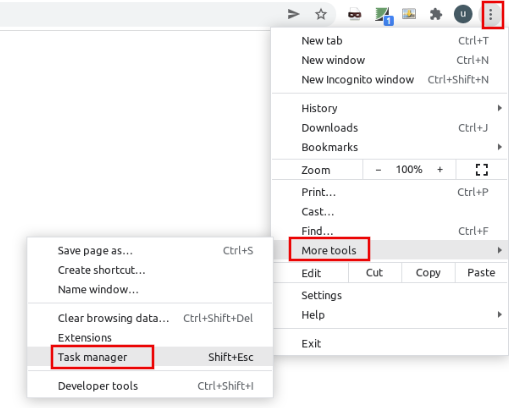
To open the Task Manager in Chrome, click on the dots icon from the top-right. Then choose More tools > Task Manager (or Shift+Esc shortcut).

It will open the Task Manager that lists all the open tabs with their memory usage and other details. However, by default, it will only show these details for the default profile.
So, if you want to see the per profile usage when using multiple profiles, then this column needs to be enabled. To do this, right-click on any of the running tasks and select Profile.

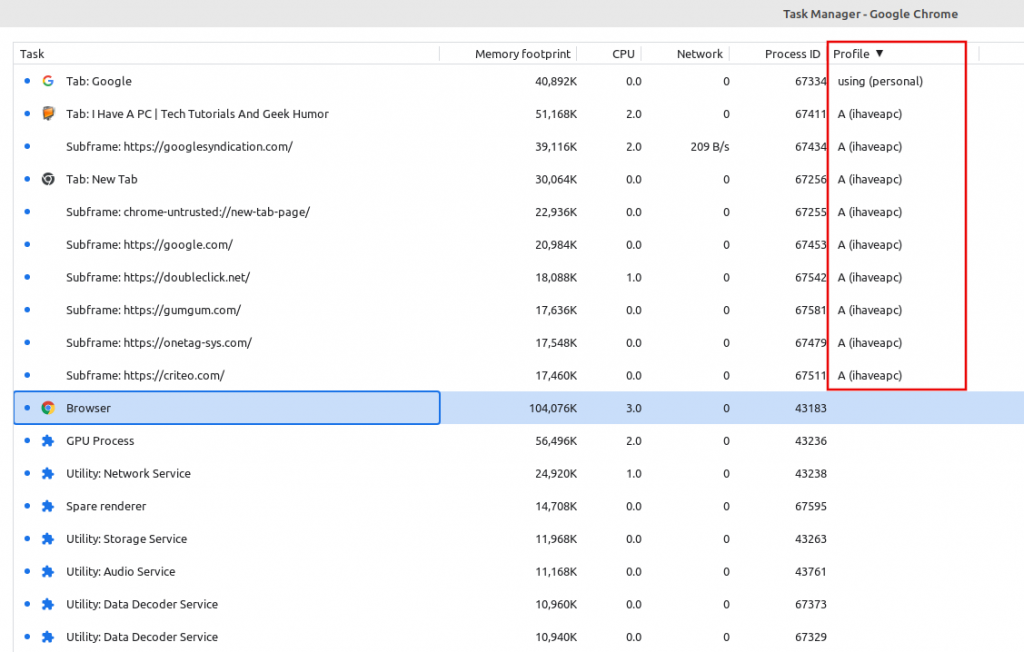
This will now display the Profile column too. While with a single profile, this column may not be needed but it can be useful when you have different tabs opened through various profiles.

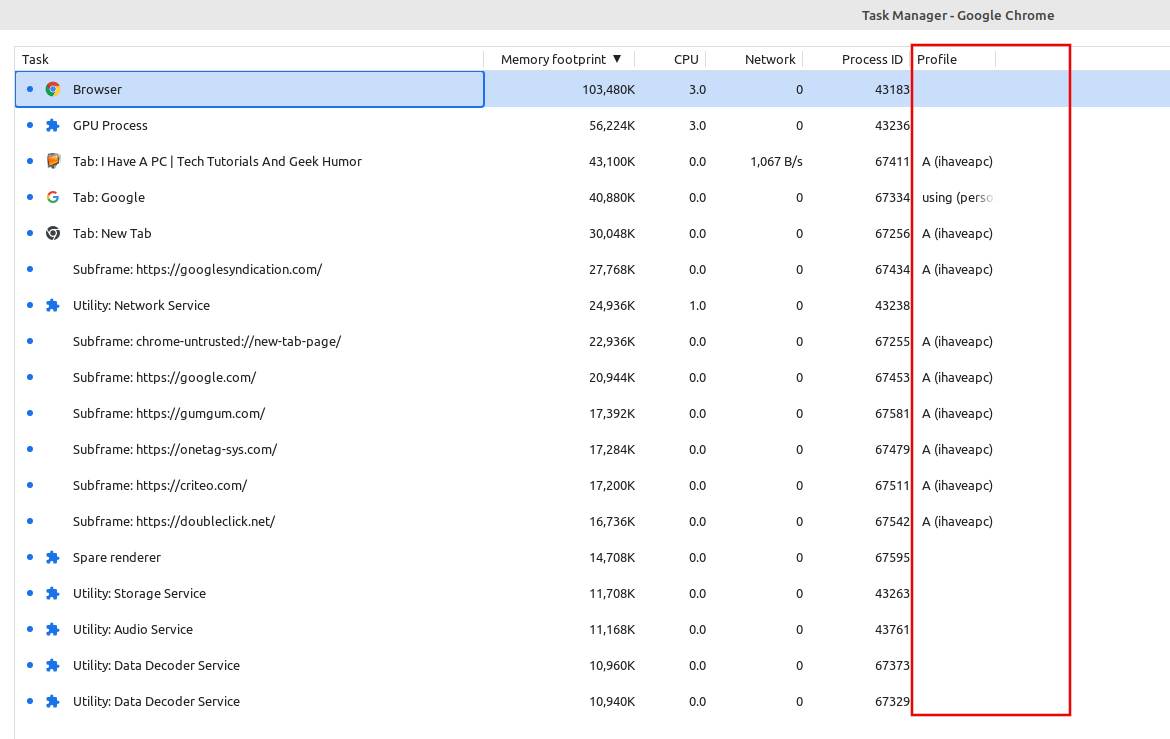
All these profile names will be shown in the Profile column.

You can also arrange them by clicking on the column to group all the running tasks for each profile.

This is often a good starting point to check for resource usage and sluggishness. If there are any unresponsive tasks/tabs that can’t be closed, select them, and click on the End process from the bottom of the Task Manager window to force close them.

Happy browsing.
