Linux Mint comes with a useful graphical tool that can analyze disk usage, and present it in the form of pretty charts. This system tool is the Disk Usage Analyzer.
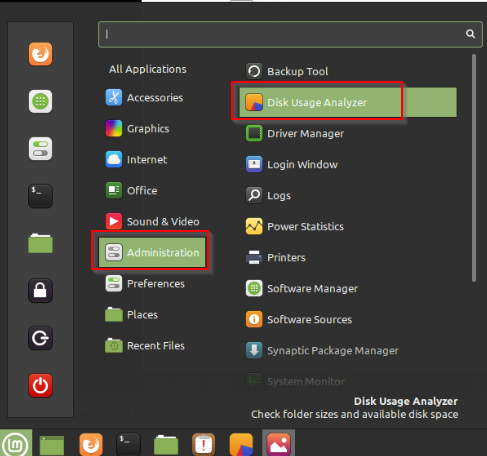
To use it, go to Administration > Disk Usage Analyzer. (This example uses Linux Mint 20.2 Cinnamon edition).
On opening it, different partitions and drives available will be listed, including the Home folder.
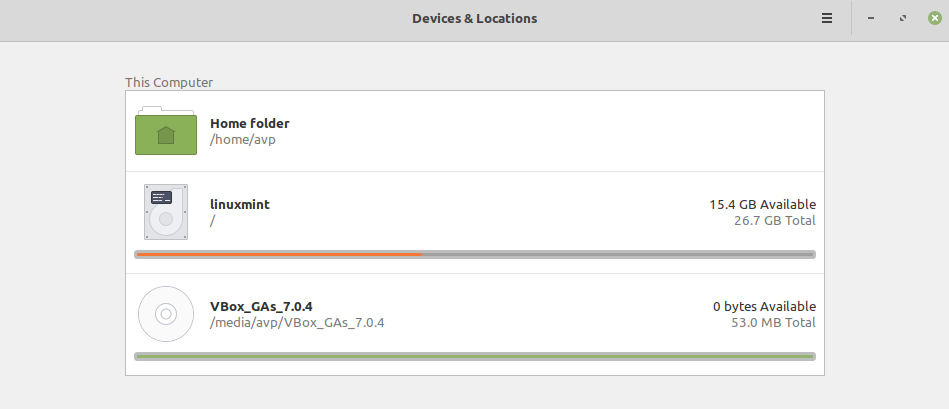
Click on any of those to analyze their detailed disk usage.
Disk Usage Analyzer includes two types of charts on the right pane:
- Rings Chart
- Treemaps Chart
Rings Chart: This is the default, and it shows the files and folder disk usage in the form of rings.
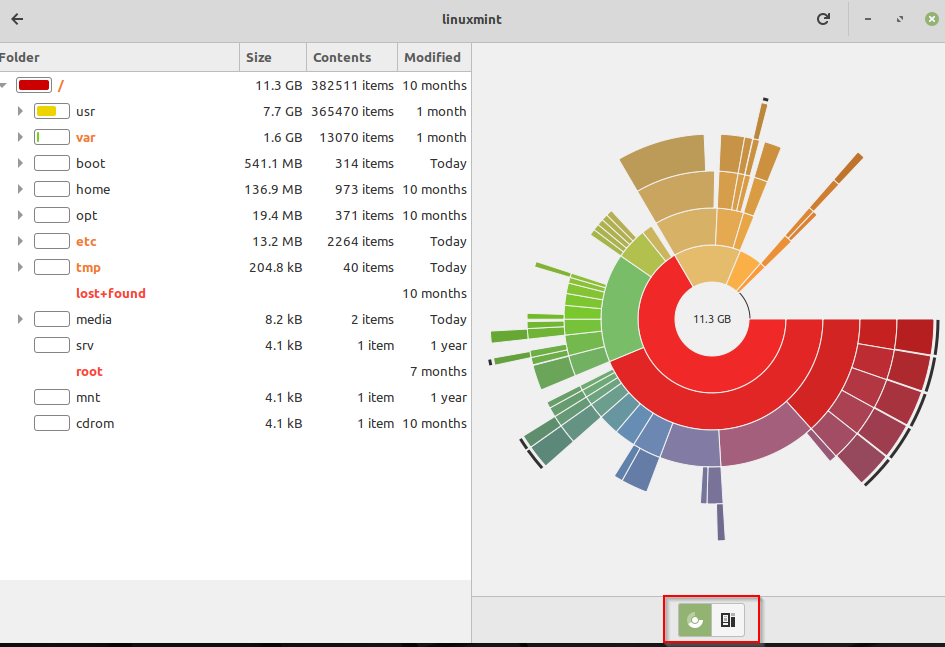


You can right-click on these rings to perform further actions.
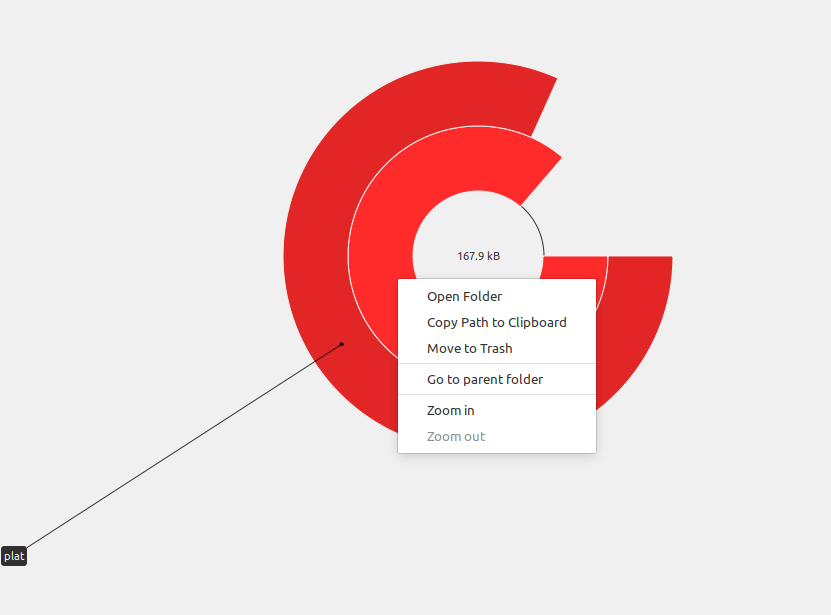
These include opening the selected folder, copying the full path to the clipboard, deleting the selected folder (choose wisely :)), opening the parent folder of the selected sub-folder, and zooming in further. Pretty detailed and granular.
Treemaps Chart: The type of chart can be changed from the bottom pane in Disk Usage Analyzer. So, you can toggle between Rings Chart and Treemaps Chart. Treemaps Chart will show the files and folder details in the form of blocks.
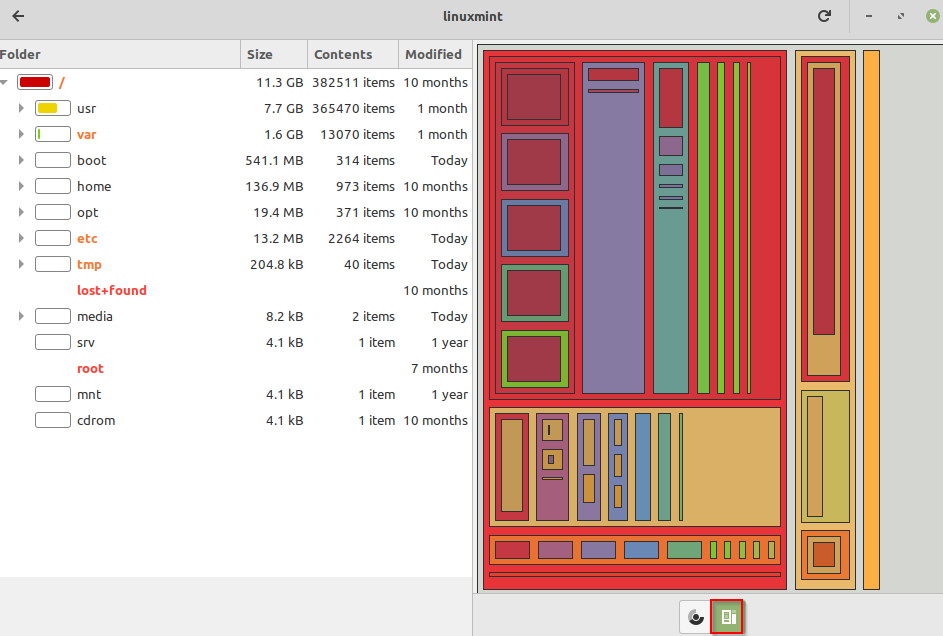
As with the Rings Chart, you can further drill down to subfolders to get a detailed view of its contents, and the disk space in use by each of them, and right-click on the specific folders from the chart for further actions.
This is a useful visual tool that comes by default in Linux Mint. It gives you a fairly good idea of the disk space usage by files and folders. Also, if you would like to free up disk space, there is another useful system tool – Stacer that does just that.
All done.