10 Useful Linux Commands that Every DevOps Should Know
In a production environment, you don’t just need to know how to navigate directories, you need to diagnose performance bottlenecks, trace network glitches, and dissect failing services under pressure. When an alert fires at 3:00 AM, basic commands won’t cut it.
Here are 10 critical Linux commands that every DevOps engineer and system administrator needs to master for production troubleshooting, complete with real-world uptime-saving flags.
1. ss (Socket Statistics)
Gone are the days of netstat (which is deprecated and slow on high-traffic systems). ss dumps socket statistics directly from kernel space, making it incredibly fast for checking network connections and ports.
Production Use Case: Identifying what process is hogging a port or tracking down unestablished connections.
The Command:
ss -tunlp
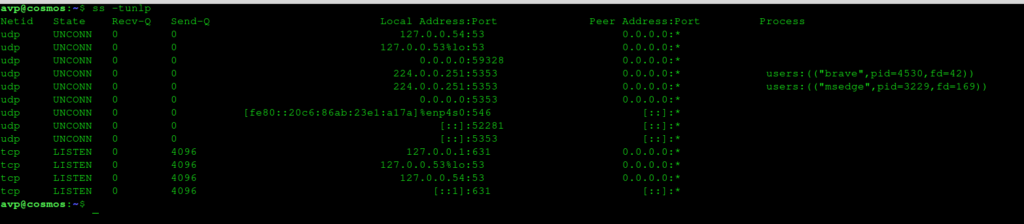
Flag Breakdown:
- -t / -u: Show TCP and UDP sockets.
- -n: Show numeric port numbers instead of resolving service names (much faster).
- -l: Show only listening sockets.
- -p: Show the process using the socket (requires sudo).
2. journalctl (Systemd Log Querying)
Modern Linux distributions rely on systemd, which stores logs in a centralized, binary format managed by the systemd-journald service. journalctl is your window into these logs.
Production Use Case: Debugging a failing container daemon or system service without digging through fragmented text files in /var/log.
The Command:
journalctl -u nginx.service -n 50 -f
Flag Breakdown:
- -u: Filter logs for a specific unit (e.g., nginx.service).
- -n 50: Show the last 50 lines.
- -f: Follow the log stream in real time.
- Pro-tip: Add –since “1 hour ago” or -p err to view only errors.
3. lsof (List Open Files)
In Linux, “everything is a file.” Network sockets, pipes, devices, and directories are all treated as files. lsof tells you exactly which process has which file or network socket open.
Production Use Case: Fixing the dreaded “Device is busy” error when trying to unmount a disk, or finding out which process is writing to a deleted log file that is still consuming disk space.
The Command:
lsof -i :8080
Flag Breakdown:
- -i :8080: Filters results to show processes interacting with port 8080.
- lsof +L1: Shows files that have been deleted from the filesystem but are still kept open in memory by a rogue process.
4. htop / top (Process Monitoring)
While top is ubiquitous, htop provides a highly readable, interactive, color-coded overview of CPU cores, memory/swap usage, and process hierarchies.

Production Use Case: Spotting CPU-hogging threads, identifying memory leaks, or killing rogue parent/child processes gracefully.
Key Controls inside htop:
- F6: Sort by CPU, Memory, or PID.
- F5: Toggle tree view to see parent-child process relationships (crucial for containerized apps).
- u: Filter processes by a specific user (e.g., www-data).
5. df & du (Disk Usage Investigation)
When a server runs out of disk space, applications crash instantly. df gives you the macro view of your filesystems, while du pinpoints the micro offenders. It is vital to know the difference between df and du.
Production Use Case: Quick triage when a disk hits 100% capacity.
The Commands:
df -h

sudo du -ahx --max-depth=1 /var | sort -rh | head -n 10
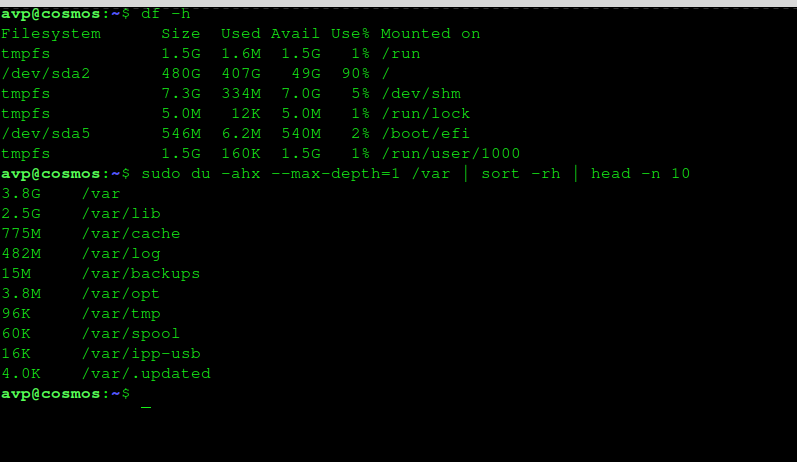
Flag Breakdown:
- df -h: Displays disk space in human-readable format (GB/MB).
- du -ahx: Includes all files (a), human-readable (h), and stays strictly within one filesystem (x prevents it from traversing mounted network storage).
- sort -rh | head -n 10: Pipes the output to sort by size and spits out the top 10 space-hogging directories.
6. curl (Network & Endpoint Verification)
curl is much more than a tool to download files; it is a DevOps swiss-army knife for testing network connectivity, API payloads, and proxy configurations directly from the terminal.
Production Use Case: Verifying if a backend service behind a reverse proxy is responding, or checking latency metrics.
The Command:
curl -Iv https://example.com
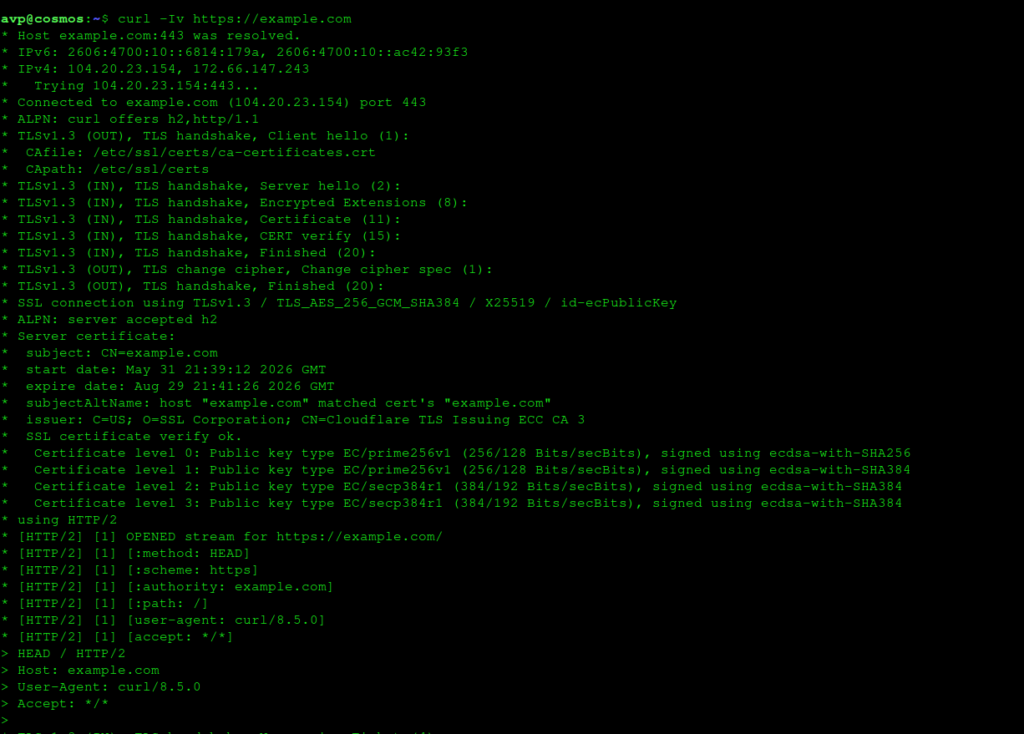
Flag Breakdown:
- -I: Fetch the HTTP headers only (great for checking status codes like 200, 404, or 502 without dumping raw HTML).
- -v: Verbose mode, which exposes the TLS handshake, certificate details, and DNS resolution steps.
7. tcpdump (Network Packet Analyzer)
When high-level tools like curl fail, you have to look at the wire. tcpdump captures and analyzes network traffic passing through your network interfaces.
Production Use Case: Troubleshooting broken handshakes, dropped packets, or routing issues between microservices.
The Command:
sudo tcpdump -i eth0 port 443 -c 100 -w capture.pcap
Flag Breakdown:
- -i eth0: Listen strictly on interface eth0.
- port 443: Filter packets to/from HTTPS port 443.
- -c 100: Stop after capturing 100 packets.
- -w capture.pcap: Write raw packets to a file so you can download and analyze it locally inside Wireshark.
8. strace (System Call Tracer)
If an application is freezing, crashing, or misbehaving and its logs are empty, strace is your ultimate diagnostic weapon. It intercepts and records the system calls made by a process.
Production Use Case: Finding out exactly why a binary is failing to start (e.g., missing a configuration file or permission denied on a hidden directory).
The Command:
sudo strace -tp 12345 -e trace=openat,connect
Flag Breakdown:
- -t: Timestamp each system call.
- -p 12345: Attach to an already running process ID.
- -e trace=…: Limit the output to specific system calls (like openat for file access or connect for network calls) to keep logs manageable.
9. rsync (Remote File Synchronization)
For moving data securely between production servers, scp is inefficient because it overwrites files blindly. rsync uses a delta-transfer algorithm, only moving the differences between source and destination files.
Production Use Case: Migrating user uploads, syncing configurations across nodes, or performing live backups.
The Command:
rsync -azP --exclude 'logs/' /data/user@remote-host:/backup/
Flag Breakdown:
- -a: Archive mode (preserves symlinks, permissions, modifications, and groups).
- -z: Compresses data during transfer to save bandwidth.
- -P: Shows a progress bar and allows resuming aborted transfers.
10. grep / awk (Text Parsing Powerhouse)
Production servers process gigabytes of logs. Knowing how to efficiently cut through text noise saves hours of scrolling.
Production Use Case: Parsing access logs to find out which unique IP addresses are hammering your endpoints.
The Command:
cat /var/log/nginx/access.log | awk '{print $1}' | sort | uniq -c | sort -rn | head -n 10
How it Works:
awk ‘{print $1}’ grabs the very first column (usually the client IP address in Nginx). It then sorts them, counts the unique occurrences (uniq -c), sorts them numerically in reverse (sort -rn), and displays the top 10 source IPs.
Command Quick-Reference
| Command | Primary Use Case | DevOps Context |
| ss | Network connections & socket auditing | Finding port conflicts and connection bottlenecks. |
| journalctl | Querying system log journal | Investigating systemd service and unit failures. |
| lsof | List open files and associated processes | Tracking down file handles and rogue locked files. |
| htop | Dynamic process and resource tracking | Live performance monitoring and resource capping. |
| df / du | Storage allocation & disk space analysis | Triage for full-disk application crashes. |
| curl | Request transfer and endpoint testing | Connectivity checks, HTTP API status validation. |
| tcpdump | Packet-level network analysis | Deep-dive network and traffic troubleshooting. |
| strace | Process system call debugging | Debugging applications when code logs fail. |
| rsync | Differential file synchronization | Efficient data migrations and configuration syncs. |
| awk / grep | RegEx extraction & log data parsing | Sifting through high-volume application logs. |
Happy exploring.

How To Switch Google’s New Gmail Theme

How To Quickly Check Your Unread Gmail From Linux Mint / Ubuntu Terminal
